
Introduction to Trading Charts
This part of the course is going to give you an brief insight into 3 types of charts that are commonly used by traders. Most traders have their own personal preferences in terms of which types of charts that they like and the only way you will know is by trying them out.
Line Charts

Line charts are formed by connecting a line from the high, low or close price of one period to the next forming a line which represents the price movement over time. There charts are great for identifying support and resistance price levels.
Bar Charts

Bar charts are formed by showing price bars representing a specific period of time on the charts. These bars are also known as the OHLC bars.

The Open, High, Low, Close (OHLC) bar is another basic formation of most charts used in the financial market.
Each bar also represents a specific duration or timeframe. The common timeframe used is the monthly, weekly, daily, four hour, 60 minute (or hourly), 30 minute, 15 minute, five minute and one minute timeframe.
As shown in the diagram above, each bar on a chart is formed based on the combination of the Open (O), High (H), Low (L) and Close (C) values. If the bar above represented a trading session, then each individual alphabet represents the following:
-
O – The opening price of the session.
-
H– The highest price of the session.
-
L– The lowest price of the session.
-
C– The closing price of the session.
Using the four values above, you can then plot the other two commonly used charts – the line chart and the candlestick chart.
Candlestick Charts

As shown in the diagram above, the candlestick (also known as Japanese Candlesticks) is also formed using the same O,H, L and C values as well. However, the difference between the OHLC and the candlestick is the visual representation of the bar.
As you can see, the real body of the candlestick represents the area between the O and C price. Meanwhile, the area between the body and the high (or low) is represented by only a wick (or tail).
In candlestick reading, the body of the candlestick plays an important role and I will elaborate further as we go along. For now, be sure that you understand how to read the candlestick and to identify the O,H, L and C values.
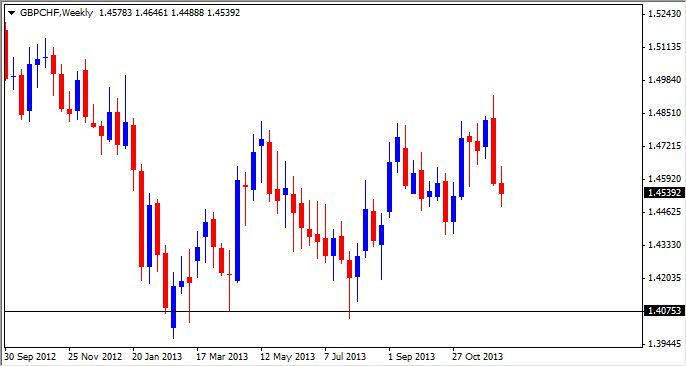
As shown in the diagram above is an example of the candlestick chart.